323 million recreation visits were recorded by the National Park Service in calendar year 2025. That total was a decrease of 8.85 million recreation visits, or 2.7%, from the record year in 2024. In 2025, 406 of the 433 National Park System units report visitor use.
We aggregated data from National Park Service, Journal of Leisure Research, and other primary sources.
Key Takeaways
- 323M323 million recreation visits were reported in the National Park System in calendar year 2025.National Park Service, 2025
- −2.7%8.85 million recreation visits, or 2.7%, was the decrease in 2025 from the record year in 2024.National Park Service, 2025
- 1.39B hrs1.39 billion recreation visitor hours were reported in 2025, a 0.7% decrease from 2024.National Park Service, 2025
- −2.4%2.4% was the decrease from 2024 for overnight stays in the National Park System.National Park Service, 2025
- 16.5M16,533,753 recreation visits were reported at Blue Ridge Parkway, the most visited site in the National Park System.National Park Service, 2025
- 15.7M15,748,676 recreation visits were reported at Golden Gate National Recreation Area, the second most visited site in the National Park System.National Park Service, 2025
- 5.0M4,984,525 recreation visits were reported at Zion National Park, the second most visited national park.National Park Service, 2025
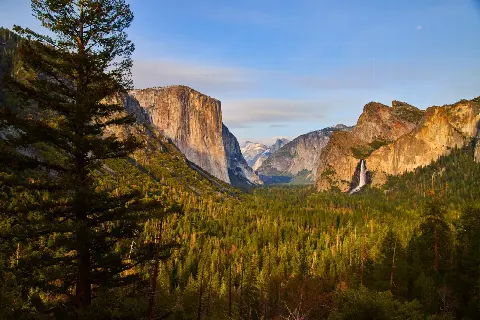
- 4.3M4,278,413 recreation visits were reported at Yosemite National Park, the fifth most visited national park.National Park Service, 2025
- $23.9B$23.9 billion was spent by visitors in communities within 60 miles of a national park in 2022.National Park Service, 2022
- $50.3B$50.3 billion was the record high benefit to the U.S. economy from national park visitor spending in 2022.National Park Service, 2022
- 378,400378,400 jobs were supported nationwide by visitor spending in 2022.National Park Service, 2022
When are America’s national parks busiest?
Recreation visits to all 63 US national parks in 2025, with each park’s busiest and quietest month. Source: NPS Visitor Use Statistics.
| Park | 2025 visits | vs 2024 | Busiest month | Quietest month |
|---|---|---|---|---|
| Great Smoky Mountains (TN) | 11,527,939 | -5% | October | January |
| Zion (UT) | 4,984,525 | +1% | May | January |
| Yellowstone (WY) | 4,762,988 | 0% | July | November |
| Grand Canyon (AZ) | 4,430,653 | -10% | May | January |
| Yosemite (CA) | 4,278,413 | +4% | July | February |
| Rocky Mountain (CO) | 4,171,431 | 0% | July | January |
| Acadia (ME) | 4,079,318 | +3% | August | February |
| Grand Teton (WY) | 3,800,648 | +5% | July | January |
| Olympic (WA) | 3,584,187 | -4% | August | January |
| Glacier (MT) | 3,136,557 | -2% | July | February |
| Cuyahoga Valley (OH) | 3,025,325 | +4% | August | February |
| Joshua Tree (CA) | 2,932,644 | -2% | March | July |
| Indiana Dunes (IN) | 2,629,497 | -3% | June | February |
| Hot Springs (AR) | 2,494,611 | +1% | June | January |
| Gateway Arch (MO) | 2,209,028 | -14% | July | January |
| Bryce Canyon (UT) | 1,967,367 | -21% | September | January |
| New River Gorge (WV) | 1,958,440 | +8% | August | January |
| Hawaiʻi Volcanoes (HI) | 1,877,854 | +31% | January | October |
| Shenandoah (VA) | 1,682,152 | -2% | October | January |
| Mount Rainier (WA) | 1,635,342 | +1% | August | February |
| Arches (UT) | 1,511,740 | +3% | May | January |
| Capitol Reef (UT) | 1,388,476 | -2% | May | January |
| Sequoia (CA) | 1,378,337 | +5% | July | February |
| Death Valley (CA) | 1,320,134 | -8% | April | June |
| Redwood (CA) | 1,202,480 | +93% | June | December |
| Badlands (SD) | 1,139,361 | +4% | July | January |
| Haleakalā (HI) | 853,711 | +17% | July | October |
| Saguaro (AZ) | 847,749 | -10% | March | August |
| Canyonlands (UT) | 796,057 | -3% | May | January |
| Kings Canyon (CA) | 779,791 | +11% | July | February |
| Everglades (FL) | 778,198 | +5% | March | October |
| Glacier Bay (AK) | 740,044 | +1% | July | February |
| Theodore Roosevelt (ND) | 729,893 | 0% | July | January |
| Mammoth Cave (KY) | 660,734 | -12% | July | October |
| White Sands (NM) | 659,742 | -6% | March | October |
| Crater Lake (OR) | 632,242 | +25% | August | February |
| Wind Cave (SD) | 606,258 | +24% | July | February |
| Big Bend (TX) | 568,104 | +1% | March | August |
| Denali (AK) | 543,300 | +17% | July | October |
| Lassen Volcanic (CA) | 504,777 | +41% | July | February |
| Biscayne (FL) | 486,567 | -5% | May | October |
| Virgin Islands (VI) | 471,074 | +11% | March | October |
| Mesa Verde (CO) | 463,130 | -4% | June | January |
| Great Sand Dunes (CO) | 432,498 | -1% | June | January |
| Kenai Fjords (AK) | 425,369 | +1% | July | November |
| Carlsbad Caverns (NM) | 410,778 | -11% | March | October |
| Pinnacles (CA) | 343,208 | -3% | March | October |
| Petrified Forest (AZ) | 315,951 | -44% | June | October |
| Congaree (SC) | 287,833 | +19% | May | January |
| Black Canyon of the Gunnison (CO) | 250,086 | -26% | June | December |
| Channel Islands (CA) | 227,186 | -13% | July | October |
| Guadalupe Mountains (TX) | 206,423 | -9% | March | January |
| Voyageurs (MN) | 206,326 | +4% | August | April |
| Great Basin (NV) | 161,210 | +6% | July | December |
| Wrangell–St. Elias (AK) | 108,840 | +33% | July | January |
| Dry Tortugas (FL) | 89,355 | +5% | May | September |
| North Cascades (WA) | 46,925 | +185% | July | December |
| American Samoa (AS) | 43,258 | +92% | April | October |
| Katmai (AK) | 34,479 | -5% | July | January |
| Isle Royale (MI) | 29,091 | +1% | August | January |
| Lake Clark (AK) | 19,778 | +7% | July | January |
| Gates of the Arctic (AK) | 14,923 | +25% | July | January |
| Kobuk Valley (AK) | 7,786 | -55% | July | December |
1. How Many Recreation Visits Did the National Park System Get In 2025?
The park system logged 323 million visits in 2025.
That is still very heavy use, even after the National Park Service reported a decrease of 8.85 million recreation visits, or 2.7%, from the record year in 2024. Time on site remained high, with 1.39 billion visitor hours. If planning a first camping trip, choose dates early and expect competition near busy parks.
| Metric | Value | Source |
|---|---|---|
| National Park System Recreation Visits, 2025 | 323 million | National Park Service, Annual Visitation Highlights (2025) |
| National Park System Visit Change, 2025 Vs 2024 | decrease of 8.85 million recreation visits, or 2.7% | National Park Service, Annual Visitation Highlights (2025) |
| National Park System Recreation Visitor Hours, 2025 | 1.39 billion; a decrease of 0.7% from 2024 | National Park Service, Annual Visitation Highlights (2025) |
| National Park System Overnight Stay Change, 2025 Vs 2024 | 2.4% decrease | National Park Service, Annual Visitation Highlights (2025) |
| National Park System Reporting Units, 2025 | 406 of 433 | National Park Service, Annual Visitation Highlights (2025) |
| National Park System Parks With Record Visits, 2025 | 26 parks, 6% of reporting parks | National Park Service, Annual Visitation Highlights (2025) |
The National Park Service counts visits, so repeat trips by the same person appear as separate visits.
2. Which National Park System Units Were Most Visited In 2025?
Blue Ridge Parkway led the National Park Service list with 16,533,753 recreation visits.
The busy end of the list is wider than the classic image of a gated national park. It includes scenic parkways, recreation areas, a memorial, a seashore, and Great Smoky Mountains National Park. That mix points to everyday access as much as destination travel, with roads, waterfronts, monuments, and urban edges all drawing heavy use.
Plan extra time for parking, road access, and crowded stops at these places.
NPS reports recreation visits, so repeat trips can be counted again.
3. Which National Parks Followed Great Smoky Mountains In 2025?
Zion came next, with 4,984,525 recreation visits.
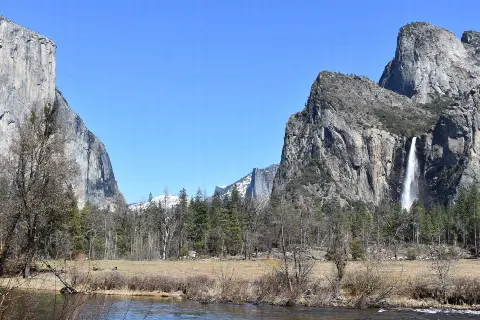
The National Park Service list points strongly west after Great Smoky Mountains. Desert canyons, high mountains, Pacific forests, and the Yellowstone region all draw very large counts. Appalachia remains present through Great Smoky Mountains, and Acadia brings the Atlantic coast into the same national conversation.
This mix matters because crowded demand is not confined to one kind of trip. Scenic drives, rim viewpoints, alpine roads, and coastal carriage roads can all meet heavy pressure in the same travel year. A person planning a Sierra Nevada trip should look at camping spots near Yosemite as early as park rules allow.
4. Is National Park Attendance Down?
No, the system logged 331,863,358 recreation visits in 2024.
The National Park Service record points to a high plateau, with 2016, 2019, 2023, and 2024 all sitting near the busiest recent levels. The clear break is 2020, at 237,064,332 recreation visits. After that disruption, use moved back toward the earlier busy track instead of settling lower.
Popular parks can still feel crowded at peak times, so book lodging, permits, shuttles, and timed entry early. Families heading to the busiest parks often camp to save on lodging, and our family camping tents guide compares larger tents for those trips.
| Metric | Value | Source |
|---|---|---|
| US National Park System Recreation Visits, 2016 | 330,971,689 | National Park Service, Visitation Numbers (2016) |
| US National Park System Recreation Visits, 2019 | 327,516,619 | National Park Service, Visitation Numbers (2019) |
| US National Park System Recreation Visits, 2020 | 237,064,332 | National Park Service, Visitation Numbers (2020) |
| US National Park System Recreation Visits, 2021 | 297,115,406 | National Park Service, Visitation Numbers (2021) |
| US National Park System Recreation Visits, 2022 | 311,985,998 | National Park Service, Visitation Numbers (2022) |
| US National Park System Recreation Visits, 2023 | 325,498,646 | National Park Service, Visitation Numbers (2023) |
| US National Park System Recreation Visits, 2024 | 331,863,358 | National Park Service, Visitation Numbers (2024) |
National Park Service figures count recreation visits, so one person can be counted more than once.
5. Where Do Recreation Visits Go by Unit Type?
National Parks took the largest share of visits in 2025, at 29%.
National Park Service data point to a system with heavy use across several labels. Recreation areas, memorials, parkways, seashores, monuments, and historic sites all account for named shares of activity, so the busiest trip corridors may sit outside the classic National Park category.
That matters for planning because traffic, parking, restrooms, overlooks, and trailheads can feel busy at places that look secondary on a map. If fixed dates make marquee entrances hard, walk-up camping near another National Park Service designation may keep a trip close to public land without chasing the most famous gate.
| Metric | Value | Source |
|---|---|---|
| National Historic Site Share Of System Visits, 2025 | 2% | National Park Service, Visitor Use Data (2025) |
| National Historical Park Share Of System Visits, 2025 | 9% | National Park Service, Visitor Use Data (2025) |
| National Memorial Share Of System Visits, 2025 | 11% | National Park Service, Visitor Use Data (2025) |
| National Monument Share Of System Visits, 2025 | 6% | National Park Service, Visitor Use Data (2025) |
| National Park Share Of System Visits, 2025 | 29% | National Park Service, Visitor Use Data (2025) |
| National Parkway Share Of System Visits, 2025 | 10% | National Park Service, Visitor Use Data (2025) |
| National Recreation Area Share Of System Visits, 2025 | 15% | National Park Service, Visitor Use Data (2025) |
| National Seashore Share Of System Visits, 2025 | 7% | National Park Service, Visitor Use Data (2025) |
National Park Service figures count visits, not people.
6. How Much Do National Park Visitors Spend Near Parks?
People on national park trips put $23.9 billion into nearby communities.
The National Park Service reported that figure for communities within 60 miles of a national park in 2022. That money reaches the trip services around park entrances, including lodging, food, fuel, groceries, repairs, shuttles, and guide operations.
Jobs show why the spending matters locally. The same report said visitor spending supported 314,600 jobs in gateway communities, out of 378,400 jobs nationwide.
For small towns near popular units, a busy season can support paychecks across many ordinary businesses. The effect also extends into the wider economy, with a record high $50.3 billion benefit to the U.S. economy reported for 2022.
The report also put NPS appropriations at $3.3 billion for fiscal year 2022, yielding more than $10 in economic boost per $1 invested. Trip choices can keep more money close to the park when travelers use local lodging, restaurants, stores, and services that fit their plans. Travelers on a tighter budget can balance that by packing some of their own meals in a camping cooler.
| Metric | Value | Source |
|---|---|---|
| US National Parks Recreation Visits, 2022 | 311,985,998 visits | National Park Service, 2022 National Park Visitor Spending Effects (2022) |
| Visitor Spending Within 60 Miles Of US National Parks, 2022 | $23.9 billion | National Park Service, 2022 National Park Visitor Spending Effects (2022) |
| US Economic Output From National Park Visitor Spending, 2022 | $50.3 billion | National Park Service, 2022 National Park Visitor Spending Effects (2022) |
| US Jobs Supported By National Park Visitor Spending, 2022 | 378,400 jobs | National Park Service, 2022 National Park Visitor Spending Effects (2022) |
| Gateway Community Jobs Supported By Visitor Spending, 2022 | 314,600 jobs | National Park Service, 2022 National Park Visitor Spending Effects (2022) |
| NPS Appropriations, Fiscal 2022 | $3.3 billion | National Park Service, 2022 National Park Visitor Spending Effects (2022) |
The National Park Service recreation total counts visits instead of people.
Most recent available data: National Park Service, 2022.
7. Who Visits National Park Service Units?
The clearest national snapshot is old: 69% of adults with household income over $150,000 had visited an NPS unit within the last two years. That points to access and trip costs as part of the story, since lower income adults had much less recent contact in the same 2008 to 2009 survey. The racial and ethnic gaps in the same source also make the profile a record of unequal access. Treat it as historical context, then check current National Park Service pages for present trip details.
The source is a weighted 2008 to 2009 CSAP national survey of U.S. adults.
Most recent available data: Journal of Leisure Research, 2009.
National Park Visitation by the Numbers
Methodology and Sources
These figures count recreation visits, visitor hours, and overnight stays, so they do not identify unique people. The public data reviewed here do not give current monthly seasonality, international visitor counts, crowd estimates, or timed entry reservation outcomes.
Watch the next NPS annual visitation release, Visitor Use Statistics dashboard update, and Visitor Spending Effects report.
Figures are reported as each source published them. Surveys with different methods are shown separately and were not combined.
- National Park Service, Annual Visitation Highlights (2025)
- National Park Service, Visitor Use Data (2025)
- National Park Service, Public Interest in National Parks Remains Strong as Visits Top 323 Million in 2025 (2025)
- National Park Service, Visitation Numbers (2024)
- National Park Service, 2022 National Park Visitor Spending Effects (2022)
- Journal of Leisure Research, Who visits U.S. national parks (and who doesn’t)? A national study of perceived constraints and vacation preferences across diverse populations (2008-2009)
Last updated: November 2026
We update this page annually.