9,388,904 acres had burned across the United States through the end of October 2026, 146% of the previous 10-year average, according to NICC. NICC counted 77,850 wildland fires in the United States in 2025. It also reported 69,556 human-caused wildfires in 2025, keeping campfire choices tied to national fire risk.
We aggregated data from Nature, National Interagency Coordination Center, U.S. Department of Agriculture, Forest Service, Pacific Northwest Research Station, and other primary sources.
Key Takeaways
- 9.4M acres9,388,904 acres had burned across the United States through the end of October 2026, 146% of the previous 10-year average.National Interagency Coordination Center, 2026
- 77,85077,850 wildland fires occurred in the United States in 2025.National Interagency Coordination Center, 2025
- 69,55669,556 human-caused wildfires occurred in the United States in 2025.National Interagency Coordination Center, 2025
- 8,2948,294 lightning-caused wildfires were reported nationally in 2025.National Interagency Coordination Center, 2025
- 36,04036,040 human-caused wildfires occurred in the Southern Area in 2025, the highest among geographic areas.National Interagency Coordination Center, 2025
- 1.0M acres1,006,158 acres burned in Alaska in 2025, the most acres among geographic areas.National Interagency Coordination Center, 2025
- $3.17B$3,166,300,000 was the total federal wildfire suppression cost in 2023 for Forest Service and DOI agencies combined.National Interagency Fire Center, 2023
- 3 yrsUp to 3 years is how long evidence suggests mortality impacts of smoke PM2.5 last after exposure.Nature, 2025
- 1.9M1.9 million cumulative excess deaths from smoke PM2.5 could be reached between 2026 and 2055.Nature, 2026-2055
1. How Many Wildfires Burned in the United States Recently?
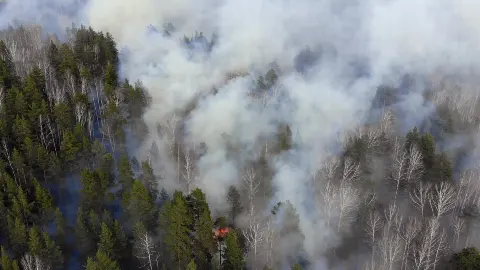
By the end of October 2026, 9,388,904 acres had burned nationwide. National Interagency Coordination Center data show why fire counts alone can mislead trip planning. A year with fewer fires can still have more burned acres. Smoke, closures, and detours can come from fire size and location as much as the number of starts. Check current fire restrictions before lighting any campfire.
| Metric | Value | Source |
|---|---|---|
| United States acres burned year to date, 2026 | 9,388,904 acres (146% of previous 10-year average) | National Interagency Coordination Center, National Significant Wildland Fire Potential Outlook (2026) |
| United States drought coverage, October 27, 2026 | Less than 50% of country | National Interagency Coordination Center, National Significant Wildland Fire Potential Outlook (2026) |
| United States wildland fires, 2025 | 77,850 fires | National Interagency Coordination Center, Total Wildland Fires and Acres (1983-2025) (2025) |
| United States wildland fire acres, 2025 | 5,131,474 acres | National Interagency Coordination Center, Total Wildland Fires and Acres (1983-2025) (2025) |
| United States wildland fires, 2024 | 64,897 fires | National Interagency Coordination Center, Total Wildland Fires and Acres (1983-2025) (2024) |
| United States wildland fire acres, 2024 | 8,924,884 acres | National Interagency Coordination Center, Total Wildland Fires and Acres (1983-2025) (2024) |
The 2026 acreage figure is year to date through the end of October.
2. How Many Wildfires Are Human Caused?
In 2025, people started 69,556 fires in the United States.
That NICC total covers a wide set of human ignition sources, so it should not be read as a campfire count. Campfires belong inside this national category, along with other causes tied to people and equipment.
Lightning is listed separately by NICC, with 8,294 lightning-caused wildfires reported nationally in 2025. That split matters for outdoor planning because prevention advice applies most directly to the human side. Check local restrictions before buying firewood for camping or lighting a fire ring.
3. Are Human Caused Wildfires the Same as Campfire Fires?
No, an escaped campsite flame belongs inside a wider category started by people, which accounts for about 58 percent of ignitions in the Pacific Northwest's fire prone landscapes. When fire restrictions are in place, a camping stove handles cooking without building a campfire.
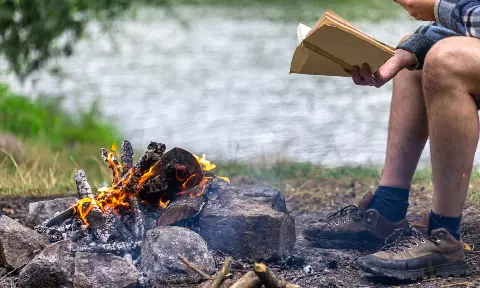
USDA treats recreation as part of that wider category, along with debris burning and other human sources. Recreation made up 32 percent of ignitions in Oregon and Washington from 1992 to 2018, so it is relevant to campfire risk without being a national campfire count.
That distinction matters at a campsite. A regional ignition share can support careful fire management, but it cannot say how many fires began in a fire ring or at a dispersed camp. If a fire is allowed, keep a campfire going only where rules, weather, and direct supervision support it.
The California figures cover large multiday fires only, exclude fires of unknown cause, and are not campfire specific.
4. Where Are Human Caused Wildfires Most Common?
In 2025, the Southern Area was the clear hot spot, with 36,040 fires tied to people.
NICC data shows why the national total is a blunt tool. The Southern Area led in human caused fire count, and it also led in total wildfire count. Alaska led in total acres burned, which means acreage and fire count can point to different parts of the map.
That split matters outdoors because each measure answers a different planning question. A high count points to places with repeated starts. A high acreage total points to places where fire activity covered more ground during the year.
Northern California adds a timing signal in the NICC outlook. Its 2026 daily ignition pace through October 27 ran above the 2008 to 2025 average, and October has its own large fire history there. Before a trip, check the current regional outlook, since the national number may miss the place shaping current risk.
5. How Much Does Wildfire Suppression Cost?
The federal bill was $3,166,300,000 in 2023.
That number from the National Interagency Fire Center reflects federal money spent after fires were already burning. It covers the Forest Service and DOI agencies, so it has narrower scope than the full public cost of wildfire. Smoke exposure, damaged homes, business losses, insurance claims, and local government work can fall outside this federal total.
The table below gives scale without treating the federal bill as the whole burden. Large bills signal organized response across federal agencies after ignition, with public budgets carrying the cost. People planning time outside should treat fire restrictions and campfire rules as cost controls, along with safety rules.
| Metric | Value | Source |
|---|---|---|
| United States federal wildfire suppression costs, 2023 | $3,166,300,000 | National Interagency Fire Center, Suppression Costs (2023) |
| United States federal wildfire suppression costs, 2022 | $3,549,000,000 | National Interagency Fire Center, Suppression Costs (2022) |
| United States federal wildfire suppression costs, 2021 | $4,389,000,000 | National Interagency Fire Center, Suppression Costs (2021) |
| United States federal wildfire suppression costs, 2020 | $2,274,000,000 | National Interagency Fire Center, Suppression Costs (2020) |
| United States federal wildfire suppression costs, 2019 | $1,590,000,000 | National Interagency Fire Center, Suppression Costs (2019) |
| United States federal wildfire suppression costs, 2018 | $3,143,256,000 | National Interagency Fire Center, Suppression Costs (2018) |
| United States federal wildfire suppression costs, 2017 | $2,918,165,000 | National Interagency Fire Center, Suppression Costs (2017) |
| United States federal wildfire suppression costs, 2016 | $1,975,545,000 | National Interagency Fire Center, Suppression Costs (2016) |
These are federal suppression costs only, with Forest Service and DOI agencies combined.
Most recent available data: National Interagency Fire Center, 2023.
6. How Does Wildfire Smoke Affect Health?
Fine particle exposure from fires can carry risk for up to 3 years after exposure.
Nature's modeled future burden is severe: cumulative excess deaths from smoke PM2.5 could reach 1.9 million from 2026 to 2055. That estimate treats fine particles as a lingering public health exposure after active flames pass.
By 2050, Nature projects 71,420 excess deaths per year from smoke PM2.5 under SSP3-7.0. The same paper places that modeled 2050 burden 73% above the estimated 2011 to 2020 average annual excess deaths from smoke.
Home exposure adds context. Fire (MDPI) reports that the wildland urban interface accounted for 10% of U.S. land area. More homes near burnable vegetation can mean more people dealing with dirty air during fire seasons, even when the flame front stays away. On high fire-danger nights, a rechargeable camping lantern can replace the campfire as your evening light and keeps smoke out of the picture.
The 2050 burden is a projection under SSP3-7.0.
Campfire and Human-Caused Wildfire by the Numbers
Methodology and Sources
The public data reviewed here give no national campfire caused wildfire count by agency and year, so human caused fires should not be read as campfires. The public data reviewed here also give no live smoke map readings or global wildfire totals.
Watch the next NICC annual wildland fire report, NIFC suppression cost update, and peer reviewed smoke mortality releases.
Figures are reported as each source published them. Surveys with different methods are shown separately and were not combined.
- Nature, Wildfire smoke exposure and mortality burden in the USA under climate change (2026-2055)
- National Interagency Coordination Center, National Significant Wildland Fire Potential Outlook (2026)
- National Interagency Coordination Center, Total Wildland Fires and Acres (1983-2025) (2025)
- National Interagency Coordination Center, Human-caused wildfires (2025)
- National Interagency Coordination Center, Wildland Fire Summary and Statistics Annual Report 2025 (2025)
- U.S. Department of Agriculture, Forest Service, Pacific Northwest Research Station, Beyond burn probability: The human side of wildfire risk (2025)
- National Interagency Fire Center, Suppression Costs (2023)
- Fire (MDPI), In the Line of Fire: Consequences of Human-Ignited Wildfires to Homes in the U.S. (1992-2015) (2020)
- Nature Communications, Human-ignited fires result in more extreme fire behavior and ecosystem impacts (2012 to 2018)
Last updated: November 2026
We update this page annually.