National Park Death and Search and Rescue Statistics (2026): 45+ Data Points on NPS Death Rates, Search and Rescue Costs, and Park Safety Patterns

NPS reported an average of 358 deaths a year in National Park Service units during 2014 to 2019.

358 deaths a year were reported on average in NPS units from 2014 to 2019, according to the National Park Service. In 2019, the National Park Service reported a mortality rate of 0.11 death per 100,000 recreational visits. From 1992 to 2007, Wilderness Medical Society reported 65,439 search and rescue incidents in US NPS units.

National Park Death and Search and Rescue Statistics (2026): 45+ Data Points on NPS death rates, Search and rescue costs, and Park safety patterns

We aggregated data from Injury, National Park Service, International Journal of Geriatric Psychiatry, and other primary sources.

Key Takeaways

1. How Many People Die in National Park Service Units?

The National Park Service reported an average of 358 deaths a year from 2014 to 2019. Against the 2019 recreation visit count, the reported rate was 0.11 death per 100,000 recreational visits. That makes death an uncommon outcome at the system level, while still creating a steady response workload. Reports came from 177 NPS units during the six-year period.

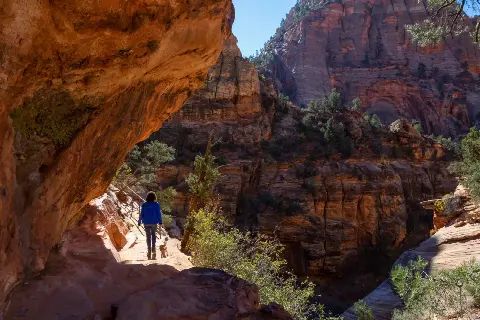
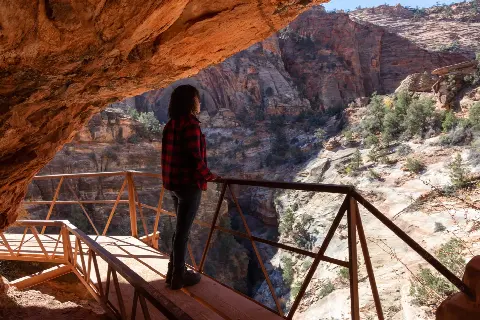
Hiker at a railed canyon viewpoint
MetricValueSource
NPS units reporting deaths, 2014 to 2019177National Park Service, Deaths in National Parks (2014-2019)
Average reported deaths per year in NPS units, 2014 to 2019358 deaths a yearNational Park Service, Deaths in National Parks (2014-2019)
Average reported deaths per week in NPS units, 2014 to 20197 deaths a weekNational Park Service, Deaths in National Parks (2014-2019)
NPS mortality rate per recreation visit count, 20190.11 death per 100,000 recreational visitsNational Park Service, Deaths in National Parks (2019)
NPS recreation visits, 2019327,516,619National Park Service, Deaths in National Parks (2019)
Male share of reported deaths in NPS units, 2014 to 201979%National Park Service, Deaths in National Parks (2014-2019)
Age 45 and older share of reported deaths in NPS units, 2014 to 201952%National Park Service, Deaths in National Parks (2014-2019)
Unintentional share of reported deaths in NPS units, 2014 to 201950%National Park Service, Deaths in National Parks (2014-2019)

The 2019 rate is based on 327,516,619 NPS recreation visits.

Most recent available data: National Park Service, 2019.

2. What Causes Deaths in National Park Service Units?

The clearest safety concern is ordinary activity, with 50% of medical fatalities tied to physical activity. National Park Service data puts health events inside the same safety context as exertion, heat, water, roads, and terrain.

Journal of Travel Medicine data also separates transportation, swimming, hiking, climbing, boating, and suicide categories. The National Park Service reported suicide in 93% of intentional deaths, which is clinical manner of death reporting and should stay separate from outdoor hazard discussion.

On summer camping trips, match exertion to health, heat, and water conditions before activity starts. On long or hot hikes, carrying a camping water filter gives you a way to refill instead of rationing.

MetricValueSource
Medical deaths during physical activity in NPS units, 2014 to 201950%National Park Service, Deaths in National Parks (2014-2019)
Suicide share of intentional deaths in NPS units, 2014 to 201993%National Park Service, Deaths in National Parks (2014-2019)
Motor vehicle crash share of visitor fatalities in US NPS units, 2003 to 200420%Journal of Travel Medicine, Recreational travel fatalities in US national parks (2003-2004)
Suicide share of visitor fatalities in US NPS units, 2003 to 200417%Journal of Travel Medicine, Recreational travel fatalities in US national parks (2003-2004)
Swimming share of visitor fatalities in US NPS units, 2003 to 200411%Journal of Travel Medicine, Recreational travel fatalities in US national parks (2003-2004)
Hiking share of visitor fatalities in US NPS units, 2003 to 200410%Journal of Travel Medicine, Recreational travel fatalities in US national parks (2003-2004)
Climbing share of visitor fatalities in US NPS units, 2003 to 20046%Journal of Travel Medicine, Recreational travel fatalities in US national parks (2003-2004)
Boating share of visitor fatalities in US NPS units, 2003 to 20045%Journal of Travel Medicine, Recreational travel fatalities in US national parks (2003-2004)

The sources use different periods, so the figures should not be combined.

Most recent available data: National Park Service, 2019.

If you or someone you know is struggling, call or text 988 to reach the Suicide and Crisis Lifeline.

3. Who Is Most Represented in Park Fatality Data?

Among recorded fatal injuries, males made up 71.5 %.

The Injury review covered the ten most visited parks from 2013 to 2022. Its age signal was strongest in the 35 to 44 group, and males in that group reported the highest fatality rates. These entries identify where deaths were recorded. They do not make age or sex a cause.

Read the demographic profile as a starting point for incident review. It tells a safety manager where the record is concentrated before a closer review of each case. The same review found the number of fatal injuries per 10 million visitors decreased from 2013 to 2022 for most parks, which keeps the profile tied to its scope.

MetricValueSource
Fatal injury rate trend in most of the ten most visited parks, 2013 to 2022decreased from 2013 to 2022 for most parksInjury, Review Enhancing safety & reducing fatalities in U.S. national parks: An evaluation of injury trends and policy implications in the ten most visited parks (2013 to 2022)
Age group with most fatal injuries in the ten most visited parks, 2013 to 202235 to 44Injury, Review Enhancing safety & reducing fatalities in U.S. national parks: An evaluation of injury trends and policy implications in the ten most visited parks (2013 to 2022)
Other age groups in fatal injuries in the ten most visited parks, 2013 to 202215 to 24 and 25 to 34, least in 0 to 14Injury, Review Enhancing safety & reducing fatalities in U.S. national parks: An evaluation of injury trends and policy implications in the ten most visited parks (2013 to 2022)
Male share of fatal injuries in the ten most visited parks, 2013 to 202271.5 %Injury, Review Enhancing safety & reducing fatalities in U.S. national parks: An evaluation of injury trends and policy implications in the ten most visited parks (2013 to 2022)
Highest fatality rate group in the ten most visited parks, 2013 to 2022Males in the 35 to 44 age groupInjury, Review Enhancing safety & reducing fatalities in U.S. national parks: An evaluation of injury trends and policy implications in the ten most visited parks (2013 to 2022)
Male share of visitor fatalities in US NPS units, 2003 to 200475%Journal of Travel Medicine, Recreational travel fatalities in US national parks (2003-2004)
Age groups share of visitor fatalities in US NPS units, 2003 to 200451%Journal of Travel Medicine, Recreational travel fatalities in US national parks (2003-2004)
Domestic visitor share of fatalities in US NPS units, 2003 to 200473%Journal of Travel Medicine, Recreational travel fatalities in US national parks (2003-2004)

Most recent available data: Injury, 2022.

4. How Many Search and Rescue Incidents Do NPS Units Handle?

The National Park Service had 65,439 cases from 1992 to 2007. Simple items such as a headlamp and extra water help if a hike takes longer than planned.

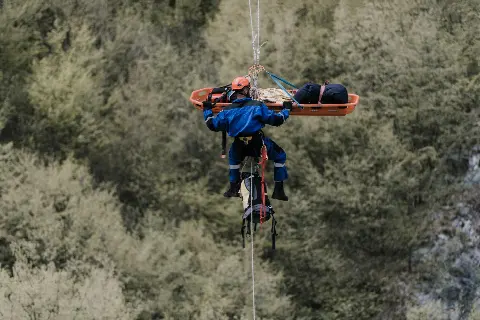
Rescuer in a harness lowering a rescue stretcher on ropes above a forested slope

The Wilderness Medical Society's review treats search and rescue as a standing workload for park operations. The records involved 78,488 individuals, so response work could include people, medical needs, logistics, and communication at the same time. These records cover National Park Service units as a system, with the burden spread across many places and activity types.

Money tells the same operational story. Direct costs reached $58,572,164, so these responses affected budgets as well as field staff. The average cost per operation was $895, a reminder that a single call can use trained staff, equipment, medical supplies, and communication time.

Plan routes, weather, timing, and how to bring enough water before leaving developed areas.

MetricValueSource
SAR incidents in US NPS units, 1992 to 200765,439 SAR incidentsWilderness Medical Society, Dead Men Walking: Search and Rescue in US National Parks (1992-2007)
Individuals involved in SAR incidents in US NPS units, 1992 to 200778,488 individualsWilderness Medical Society, Dead Men Walking: Search and Rescue in US National Parks (1992-2007)
Ill or injured individuals in SAR incidents in US NPS units, 1992 to 200724,288 ill or injured individualsWilderness Medical Society, Dead Men Walking: Search and Rescue in US National Parks (1992-2007)
Saves in SAR incidents in US NPS units, 1992 to 200713,212 savesWilderness Medical Society, Dead Men Walking: Search and Rescue in US National Parks (1992-2007)
Average daily SAR incidents in US NPS units, 1992 to 200711.2 SAR incidents per dayWilderness Medical Society, Dead Men Walking: Search and Rescue in US National Parks (1992-2007)
Average cost per SAR operation in US NPS units, 1992 to 2007$895 per operationWilderness Medical Society, Dead Men Walking: Search and Rescue in US National Parks (1992-2007)
Total SAR costs in US NPS units, 1992 to 2007$58,572,164Wilderness Medical Society, Dead Men Walking: Search and Rescue in US National Parks (1992-2007)

Most recent available data: Wilderness Medical Society, 2007.

5. Who Is Found Alive in Search and Rescue Cases?

Most older adults in SAR incidents survived, at 87.8%.

Geriatric Psychiatry reported higher death risk with water or wetlands, extreme weather, and prolonged searches. The meaning is simple: exposure and location matter after someone goes missing. Wet areas can complicate movement and detection.

Harsh weather can narrow the time before a rescue becomes medical. Trip planning should treat creek crossings, wetlands, and severe weather as time sensitive hazards, and winter camping tips fit that concern.

MetricValueSource
Older adults found alive in SAR incidents, United States, 1985 to 201387.8%International Journal of Geriatric Psychiatry, Search and rescue incidents among persons 65 years and older in the USA: Examination of factors associated with death (1985-2013)
Older adults found dead in SAR incidents, United States, 1985 to 201312.2%International Journal of Geriatric Psychiatry, Search and rescue incidents among persons 65 years and older in the USA: Examination of factors associated with death (1985-2013)
Male gender odds ratio in older adult SAR deaths, United States, 1985 to 20131.46International Journal of Geriatric Psychiatry, Search and rescue incidents among persons 65 years and older in the USA: Examination of factors associated with death (1985-2013)
Cognitively intact odds ratio in older adult SAR deaths, United States, 1985 to 20130.32International Journal of Geriatric Psychiatry, Search and rescue incidents among persons 65 years and older in the USA: Examination of factors associated with death (1985-2013)
Prolonged duration odds ratio in older adult SAR deaths, United States, 1985 to 20131.028International Journal of Geriatric Psychiatry, Search and rescue incidents among persons 65 years and older in the USA: Examination of factors associated with death (1985-2013)
Water or wetlands odds ratio in older adult SAR deaths, United States, 1985 to 20137.40International Journal of Geriatric Psychiatry, Search and rescue incidents among persons 65 years and older in the USA: Examination of factors associated with death (1985-2013)
Extreme weather odds ratio in older adult SAR deaths, United States, 1985 to 20132.06International Journal of Geriatric Psychiatry, Search and rescue incidents among persons 65 years and older in the USA: Examination of factors associated with death (1985-2013)

The study covered 1,703 included SAR incidents involving persons aged 65 and older in the United States from 1985 to 2013.

Most recent available data: International Journal of Geriatric Psychiatry, 2013.

6. Which NPS Units Have the Most Search and Rescue Work?

A small group carries the load, with 50% of operations happening in a handful of units.

The Wilderness & Environmental Medicine review of National Park Service records describes a workload concentrated in a few places across the system. That concentration matters because staffing, aircraft, communications, and medical response can face repeated pressure in the same parks.

Cost data tell a second story. Yosemite's share of total NPS costs shows how concentrated the bill can become, while Wrangell-St. Elias and Denali show how high mountain settings can carry high average costs. A trip in these parks deserves conservative planning, since rescues can carry high costs.

The source is based on National Park Service records from 2005.

Most recent available data: Wilderness & Environmental Medicine, 2005.

National Park Death and Search and Rescue by the Numbers

MetricValueSource
Average reported deaths per year in NPS units, 2014 to 2019358 deaths a yearNational Park Service, Deaths in National Parks (2014-2019)
Average reported deaths per week in NPS units, 2014 to 20197 deaths a weekNational Park Service, Deaths in National Parks (2014-2019)
NPS mortality rate per recreation visit count, 20190.11 death per 100,000 recreational visitsNational Park Service, Deaths in National Parks (2019)
NPS recreation visits, 2019327,516,619National Park Service, Deaths in National Parks (2019)
Male share of reported deaths in NPS units, 2014 to 201979%National Park Service, Deaths in National Parks (2014-2019)
Unintentional share of reported deaths in NPS units, 2014 to 201950%National Park Service, Deaths in National Parks (2014-2019)
Medical deaths during physical activity in NPS units, 2014 to 201950%National Park Service, Deaths in National Parks (2014-2019)
Suicide share of intentional deaths in NPS units, 2014 to 201993%National Park Service, Deaths in National Parks (2014-2019)
Motor vehicle crash share of visitor fatalities in US NPS units, 2003 to 200420%Journal of Travel Medicine, Recreational travel fatalities in US national parks (2003-2004)
Swimming share of visitor fatalities in US NPS units, 2003 to 200411%Journal of Travel Medicine, Recreational travel fatalities in US national parks (2003-2004)
Hiking share of visitor fatalities in US NPS units, 2003 to 200410%Journal of Travel Medicine, Recreational travel fatalities in US national parks (2003-2004)
Male share of fatal injuries in the ten most visited parks, 2013 to 202271.5 %Injury, Review Enhancing safety & reducing fatalities in U.S. national parks: An evaluation of injury trends and policy implications in the ten most visited parks (2013 to 2022)
Highest fatality rate group in the ten most visited parks, 2013 to 2022Males in the 35 to 44 age groupInjury, Review Enhancing safety & reducing fatalities in U.S. national parks: An evaluation of injury trends and policy implications in the ten most visited parks (2013 to 2022)
SAR incidents in US NPS units, 1992 to 200765,439 SAR incidentsWilderness Medical Society, Dead Men Walking: Search and Rescue in US National Parks (1992-2007)
Individuals involved in SAR incidents in US NPS units, 1992 to 200778,488 individualsWilderness Medical Society, Dead Men Walking: Search and Rescue in US National Parks (1992-2007)
Saves in SAR incidents in US NPS units, 1992 to 200713,212 savesWilderness Medical Society, Dead Men Walking: Search and Rescue in US National Parks (1992-2007)
Average daily SAR incidents in US NPS units, 1992 to 200711.2 SAR incidents per dayWilderness Medical Society, Dead Men Walking: Search and Rescue in US National Parks (1992-2007)
Average cost per SAR operation in US NPS units, 1992 to 2007$895 per operationWilderness Medical Society, Dead Men Walking: Search and Rescue in US National Parks (1992-2007)
Total SAR costs in US NPS units, 1992 to 2007$58,572,164Wilderness Medical Society, Dead Men Walking: Search and Rescue in US National Parks (1992-2007)
Grand Canyon National Park SAR operations, 2005307Wilderness & Environmental Medicine, Dead men walking: search and rescue in US National Parks (2005)

Methodology and Sources

The public data reviewed here does not show a current national death count for the article year, unique people behind NPS visits, or complete current state rankings. It also does not verify unexplained disappearances or current homicide counts across all units.

Watch the next National Park Service mortality dashboard, annual visitation release, and search and rescue annual summaries.

Figures are reported as each source published them. Surveys with different methods are shown separately and were not combined.

Last updated: November 2026

We update this page annually.

Jack Fletcher, founder and outdoor editor at CampingKnow

Jack Fletcher

Founder & Outdoor Editor at CampingKnow

Jack writes about camping gear, tents, sleep systems, campsite comfort, and the practical details that make the difference between a great night outdoors and a miserable one. His approach is simple: look past the marketing, understand the specs, consider how the gear will actually be used, and make the trade-offs clear.

More about Jack →