Hiking Statistics (2026): 40+ Data Points on U.S. Hiking Participation, Trail Use and Spending, and Hiking Safety Data

In 2023, 20.0% of the U.S. population aged six and older participated in day hiking.

20.0% of the U.S. population aged six and older participated in day hiking in 2023, according to the Outdoor Foundation. Earlier Outdoor Foundation data counted 57.8 million Americans ages 6 and over participating in hiking in 2020. Across outdoor recreation, the Outdoor Foundation and OIA reported 175.8 million participants in 2023, representing 57.3% of the United States population.

Hiking Statistics (2026): 40+ Data Points on U.S. Hiking Participation, Trail Use And Spending, and Hiking Safety Data

We aggregated data from Outdoor Foundation, Ecological Restoration, National Park Service, and other primary sources.

Key Takeaways

1. How Many Americans Hike?

About 20.0% of Americans age six and older went day hiking in 2023. Outdoor Foundation data puts day hiking among the broad participation activities, with a wide age base and a low barrier to entry. For longer day hikes, a supportive pack matters more than any single gadget, and our best camping backpack picks cover a range of capacities.

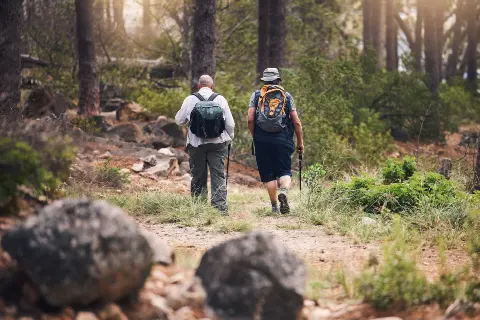
Two hikers with backpacks on a forest trail

The 2022 count of 881,000 new hikers also points to regular beginner interest in trail use. A short local walk can pair well with plans to start camping, since both reward simple preparation and realistic distance choices.

MetricValueSource
United States Age Six And Older Day Hiking Rate, 202320.0%Outdoor Foundation, 2024 Outdoor Participation Trends Report (2023)
United States New Hikers, 2022881,000Outdoor Foundation, 2023 Outdoor Participation Trends Report (2022)
United States Age Six And Older Hiking Participants, 202057.8 million participantsOutdoor Foundation, 2021 Outdoor Participation Trends Report (2020)
United States Age Six And Older Hiking Rate, 202019.0%Outdoor Foundation, 2021 Outdoor Participation Trends Report (2020)
United States Hiking Popularity Rank, 20202Outdoor Foundation, 2021 Outdoor Participation Trends Report (2020)
United States Outdoor Recreation Participants, 2023175.8 million participants; 57.3% of the United States populationOutdoor Foundation and Outdoor Industry Association, 2024 Outdoor Participation Trends Report (2023)
United States First Time Outdoor Recreation Participants, 20237.7 million AmericansOutdoor Foundation and Outdoor Industry Association, 2024 Outdoor Participation Trends Report (2023)

Outdoor Foundation figures here cover the U.S. population age six and older.

Most recent available data: Outdoor Foundation, 2023.

2. Who Is Counted in Hiking and Outdoor Participation?

The cleanest current demographic snapshot covers broad recreation: 69.7% of 2023 participants were White.

Outdoor Foundation describes all outdoor recreation participants in 2023, so it is the freshest race and ethnicity source here. It should not be read as a trail-only profile.

Wilderness & Environmental Medicine gives activity rates from 2002 for adults and women, including hiking and backpacking. Those figures are useful historical context, but they are older and activity-specific.

Use local permit, club, and park records before making trail access or programming decisions.

The sources describe different populations, so the 2002 activity rates and the 2023 Outdoor Foundation profile should stay separate.

Most recent available data: Wilderness & Environmental Medicine, 2023.

3. What Do National Forest Hiking and Biking Trips Cost?

A nonlocal overnight outing averaged $246 for each party. Journal of Forestry data from 2000 to 2003 split national forest hiking and biking visits by distance from home and whether people stayed overnight. That split matters because about 68% of visits were local day outings, while about 17% were nonlocal overnight outings.

Money planning should follow the kind of outing, since the same trail activity can sit in a low-spend local day pattern or a higher-spend travel pattern. If you want to start camping, a local overnight plan can keep the outing tied to nearby forests.

MetricValueSource
United States National Forest Nonlocal Day Trip Spending By Hikers And Bikers, 2000 To 2003$37Journal of Forestry, National Forest Visitor Spending Averages and the Influence of Trip-Type and Recreation Activity (2000-2003)
United States National Forest Nonlocal Overnight Trip Spending By Hikers And Bikers, 2000 To 2003$246Journal of Forestry, National Forest Visitor Spending Averages and the Influence of Trip-Type and Recreation Activity (2000-2003)
United States National Forest Local Day Trip Spending By Hikers And Bikers, 2000 To 2003$20Journal of Forestry, National Forest Visitor Spending Averages and the Influence of Trip-Type and Recreation Activity (2000-2003)
United States National Forest Local Overnight Trip Spending By Hikers And Bikers, 2000 To 2003$87Journal of Forestry, National Forest Visitor Spending Averages and the Influence of Trip-Type and Recreation Activity (2000-2003)
United States National Forest Nonlocal Day Hiking And Biking Visit Share, 2000 To 20039%Journal of Forestry, National Forest Visitor Spending Averages and the Influence of Trip-Type and Recreation Activity (2000-2003)
United States National Forest Nonlocal Overnight Hiking And Biking Visit Share, 2000 To 200317%Journal of Forestry, National Forest Visitor Spending Averages and the Influence of Trip-Type and Recreation Activity (2000-2003)
United States National Forest Local Day Hiking And Biking Visit Share, 2000 To 200368%Journal of Forestry, National Forest Visitor Spending Averages and the Influence of Trip-Type and Recreation Activity (2000-2003)
United States National Forest Local Overnight Hiking And Biking Visit Share, 2000 To 20037%Journal of Forestry, National Forest Visitor Spending Averages and the Influence of Trip-Type and Recreation Activity (2000-2003)

The source reports averages per party per trip for 2000 to 2003.

Most recent available data: Journal of Forestry, 2003.

4. How Much Do People Use and Spend on Trails?

State reports show real money moving through outdoor systems, led by Washington's $4.3 billion from nonlocal day trips. That kind of trip spending means trail access is tied to gas stations, groceries, restaurants, lodging, and gear shops. The Washington Recreation and Conservation Office also counted $230 million from local day trips and $3.9 billion from nonlocal overnight trips, so both quick outings and travel itineraries matter.

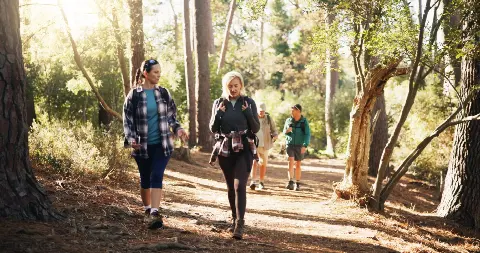
Group of people walking a wooded trail

The same report lists over 12,000 miles of Washington trails, which points to a large management burden. Mileage brings maintenance needs, signs, parking pressure, drainage work, and seasonal repair. Those costs sit beside the economic benefits that communities often see near popular access points.

Arizona adds a demand signal from the user side. The University of Arizona reported 83,110,000 visits for non-motorized recreation, with 59.2% of adults taking part and users averaging 27 visits in the past year. At a smaller scale, Ecological Restoration found hiking made up 30.2% of site visits at two northeast Indiana forest restoration sites, showing trail activity can be visible even outside marquee destinations.

MetricValueSource
Washington Local Day Trail User Spending, 2019$230 millionWashington Recreation and Conservation Office, Economic, Environmental, & Social Benefits of Recreational Trails in Washington State (2019)
Washington Nonlocal Day Trail User Spending, 2019$4.3 billionWashington Recreation and Conservation Office, Economic, Environmental, & Social Benefits of Recreational Trails in Washington State (2019)
Washington Nonlocal Overnight Trail User Spending, 2019$3.9 billionWashington Recreation and Conservation Office, Economic, Environmental, & Social Benefits of Recreational Trails in Washington State (2019)
Washington Trail Miles, 2019over 12,000 milesWashington Recreation and Conservation Office, Economic, Environmental, & Social Benefits of Recreational Trails in Washington State (2019)
Arizona Resident Nonmotorized Trail Visits, 201983,110,000 visitsUniversity of Arizona Cooperative Extension, The Economic Value of Trails in Arizona: A Travel Cost Method Study (2019)
Arizona Adult Nonmotorized Trail Use Rate, 201959.2%University of Arizona Cooperative Extension, The Economic Value of Trails in Arizona: A Travel Cost Method Study (2019)
Arizona Annual Nonmotorized Trail Visits Per User, 201927 visitsUniversity of Arizona Cooperative Extension, The Economic Value of Trails in Arizona: A Travel Cost Method Study (2019)
Northeast Indiana Hiking Share Of Site Visits, 202330.2%Ecological Restoration, Visitor use and activities detected using trail cameras at forest restoration sites (2023)

Washington's mileage includes motorized and non-motorized trails.

Most recent available data: Washington Recreation and Conservation Office, 2023.

5. How Common Are Hiking Injuries and Preparedness Gaps?

On long Appalachian Trail trips, 64% of surveyed backpackers reported foot blisters.

That points to ordinary, trip-disrupting problems more than dramatic backcountry emergencies. The American Journal of Medicine also recorded diarrhea, skin irritation, acute joint pain, and vector-borne disease among responding backpackers, which makes sanitation, foot care, and bug protection part of basic planning.

Short outings can still leave people underpacked. In the New Hampshire survey, the most cited reason for leaving essential items behind was a short trip, while KOA-style car comfort does not remove the need for water, layers, light, and first aid.

The National Park Service figure on medical deaths is narrower. It says 50% of medical deaths in national parks from 2014 to 2019 occurred during physical activity such as hiking, biking, or swimming. Two simple preparedness items close many of these gaps: a camping water filter for refilling on longer routes and a headlamp in case a hike runs past sunset.

MetricValueSource
New Hampshire Surveyed Hikers Carrying All Essential Items, 201117.8% (n = 197)Wilderness Medical Society, An Analysis of Hiker Preparedness: A Survey of Hiker Habits in New Hampshire (2011)
New Hampshire Surveyed Hikers Reason For Omitting Essential Items, 2011short trip at 32.2% (n = 162)Wilderness Medical Society, An Analysis of Hiker Preparedness: A Survey of Hiker Habits in New Hampshire (2011)
Appalachian Trail Backpackers With Feet Blisters, 199764% (n = 180)The American Journal of Medicine, Medical risks of wilderness hiking (1997)
Appalachian Trail Backpackers With Diarrhea, 199756% (n = 156)The American Journal of Medicine, Medical risks of wilderness hiking (1997)
Appalachian Trail Backpackers With Skin Irritation, 199751% (n = 143)The American Journal of Medicine, Medical risks of wilderness hiking (1997)
Appalachian Trail Backpackers With Acute Joint Pain, 199736% (n = 102)The American Journal of Medicine, Medical risks of wilderness hiking (1997)
Appalachian Trail Backpackers With Vector Borne Disease, 19974% (n = 11)The American Journal of Medicine, Medical risks of wilderness hiking (1997)

Most recent available data: National Park Service, 2019.

Hiking by the Numbers

MetricValueSource
United States Age Six And Older Day Hiking Rate, 202320.0%Outdoor Foundation, 2024 Outdoor Participation Trends Report (2023)
United States New Hikers, 2022881,000Outdoor Foundation, 2023 Outdoor Participation Trends Report (2022)
United States Age Six And Older Hiking Participants, 202057.8 million participantsOutdoor Foundation, 2021 Outdoor Participation Trends Report (2020)
United States Age Six And Older Hiking Rate, 202019.0%Outdoor Foundation, 2021 Outdoor Participation Trends Report (2020)
United States Hiking Popularity Rank, 20202Outdoor Foundation, 2021 Outdoor Participation Trends Report (2020)
United States Outdoor Recreation Participants, 2023175.8 million participants; 57.3% of the United States populationOutdoor Foundation and Outdoor Industry Association, 2024 Outdoor Participation Trends Report (2023)
United States First Time Outdoor Recreation Participants, 20237.7 million AmericansOutdoor Foundation and Outdoor Industry Association, 2024 Outdoor Participation Trends Report (2023)
United States Mean Hiking Trips Per Hiker, 1994 To 19959.1 tripsUSDA Forest Service, Outdoor Recreation Participation Trends (1994-95)
United States Total Hiking Trips, 1994 To 1995434.23 million tripsUSDA Forest Service, Outdoor Recreation Participation Trends (1994-95)
United States Mean Hiking Days Per Hiker, 1994 To 199516.8 daysUSDA Forest Service, Outdoor Recreation Participation Trends (1994-95)
United States Total Hiking Days, 1994 To 1995804.7 million daysUSDA Forest Service, Outdoor Recreation Participation Trends (1994-95)
United States Outdoor Recreation Participant Race And Ethnicity, 202369.7% White, 10.3% Black, 13.4% Hispanic, 5.3% Asian or Pacific Islander, 1.4% otherOutdoor Foundation and Outdoor Industry Association, 2024 Outdoor Participation Trends Report (2023)
United States National Forest Nonlocal Overnight Trip Spending By Hikers And Bikers, 2000 To 2003$246Journal of Forestry, National Forest Visitor Spending Averages and the Influence of Trip-Type and Recreation Activity (2000-2003)
United States National Forest Local Day Hiking And Biking Visit Share, 2000 To 200368%Journal of Forestry, National Forest Visitor Spending Averages and the Influence of Trip-Type and Recreation Activity (2000-2003)
Washington Nonlocal Day Trail User Spending, 2019$4.3 billionWashington Recreation and Conservation Office, Economic, Environmental, & Social Benefits of Recreational Trails in Washington State (2019)
Washington Nonlocal Overnight Trail User Spending, 2019$3.9 billionWashington Recreation and Conservation Office, Economic, Environmental, & Social Benefits of Recreational Trails in Washington State (2019)
Arizona Resident Nonmotorized Trail Visits, 201983,110,000 visitsUniversity of Arizona Cooperative Extension, The Economic Value of Trails in Arizona: A Travel Cost Method Study (2019)
Appalachian Trail Backpackers With Feet Blisters, 199764% (n = 180)The American Journal of Medicine, Medical risks of wilderness hiking (1997)
Appalachian Trail Backpackers With Diarrhea, 199756% (n = 156)The American Journal of Medicine, Medical risks of wilderness hiking (1997)
New Hampshire Surveyed Hikers Carrying All Essential Items, 201117.8% (n = 197)Wilderness Medical Society, An Analysis of Hiker Preparedness: A Survey of Hiker Habits in New Hampshire (2011)

Methodology and Sources

The public data reviewed here do not give a current national count of unique hikers after 2020, and NPS visit data does not identify unique people. They also do not answer rescue billing, helicopter costs, the most challenging hike, or a ranked list of dangerous parks.

Watch the next Outdoor Participation Trends Report, National Park Service mortality summaries, USDA National Visitor Use Monitoring updates, and state trail economic reports.

Figures are reported as each source published them. Surveys with different methods are shown separately and were not combined.

Last updated: November 2026

We update this page annually.

Jack Fletcher, founder and outdoor editor at CampingKnow

Jack Fletcher

Founder & Outdoor Editor at CampingKnow

Jack writes about camping gear, tents, sleep systems, campsite comfort, and the practical details that make the difference between a great night outdoors and a miserable one. His approach is simple: look past the marketing, understand the specs, consider how the gear will actually be used, and make the trade-offs clear.

More about Jack →