$1.3 trillion was the BEA's U.S. outdoor recreation gross output figure for 2024. BEA also reported $696.7 billion in value added that year. Outdoor recreation supported 5.2 million U.S. jobs in 2024, according to BEA.
We aggregated data from U.S. Bureau of Economic Analysis, Bureau of Economic Analysis, Outdoor Industry Association, and other primary sources.
Key Takeaways
- $1.3T$1.3 trillion was U.S. outdoor recreation gross output in 2024.U.S. Bureau of Economic Analysis, 2024
- $696.7B$696.7 billion was the value added of the outdoor recreation economy in 2024.U.S. Bureau of Economic Analysis, 2024
- 2.4%2.4 percent of current-dollar gross domestic product came from outdoor recreation economy value added in 2024.U.S. Bureau of Economic Analysis, 2024
- 5.2M5.2 million jobs were supported by outdoor recreation in the U.S. in 2024.U.S. Bureau of Economic Analysis, 2024
- $38.4B$38.4 billion in current-dollar value added made boating/fishing the largest conventional activity nationally, and it was the largest conventional activity in 34 states.U.S. Bureau of Economic Analysis, 2024
- $27.5B$27.5 billion in current-dollar value added made RVing the second-largest conventional activity nationally, and it was the largest conventional activity in nine states.U.S. Bureau of Economic Analysis, 2024
- $7.8B$7.8 billion in value added came from climbing/hiking/tent camping in 2024.U.S. Bureau of Economic Analysis, 2024
- $87.9B$87.9 billion made California the largest state for outdoor recreation value added in 2024.U.S. Bureau of Economic Analysis, 2024
- 6.1%6.1 percent in Hawaii to 1.0 percent in the District of Columbia was the range for outdoor recreation value added as a share of state GDP.U.S. Bureau of Economic Analysis, 2024
- 2.7%2.7 percent was the 2024 increase in inflation-adjusted outdoor recreation GDP, slightly below 2.8 percent for the overall U.S. economy and decelerating from 5.3 percent in 2023.U.S. Bureau of Economic Analysis, 2024, 2023
- $887B$887 billion in annual consumer spending is generated by outdoor recreation in the United States.Outdoor Industry Association, 2017
How Big Is Outdoor Recreation in Your State?
Outdoor recreation value added, share of state GDP and jobs in 2024, for all 50 states and DC. Source: U.S. Bureau of Economic Analysis.
| State | Value added | Share of GDP | Jobs | Share of jobs |
|---|---|---|---|---|
| Hawaii | $7.2B | 6.1% | 51,118 | 7.2% |
| Alaska | $3.8B | 5.3% | 24,458 | 6.7% |
| Montana | $3.8B | 4.9% | 32,094 | 5.9% |
| Vermont | $2.2B | 4.7% | 16,682 | 5.1% |
| Wyoming | $2.3B | 4.5% | 16,545 | 5.5% |
| Maine | $3.9B | 4.0% | 32,037 | 4.8% |
| Florida | $65.3B | 3.8% | 508,656 | 4.9% |
| Idaho | $4.5B | 3.5% | 39,228 | 4.3% |
| New Hampshire | $4.2B | 3.5% | 33,313 | 4.6% |
| Colorado | $18.1B | 3.3% | 137,762 | 4.5% |
| Indiana | $17.1B | 3.3% | 110,044 | 3.3% |
| Utah | $9.7B | 3.3% | 75,182 | 4.1% |
| Nevada | $8.4B | 3.1% | 60,742 | 3.8% |
| Louisiana | $10.0B | 3.0% | 60,462 | 2.9% |
| South Carolina | $10.2B | 2.8% | 92,135 | 3.8% |
| Tennessee | $15.6B | 2.8% | 114,070 | 3.3% |
| Arizona | $15.4B | 2.7% | 118,672 | 3.5% |
| Minnesota | $13.9B | 2.7% | 99,145 | 3.2% |
| Mississippi | $4.2B | 2.7% | 36,605 | 2.9% |
| Oregon | $9.0B | 2.7% | 76,063 | 3.7% |
| Rhode Island | $2.1B | 2.7% | 20,505 | 3.9% |
| South Dakota | $2.1B | 2.7% | 18,816 | 3.8% |
| Washington | $23.5B | 2.7% | 129,088 | 3.4% |
| Wisconsin | $12.0B | 2.7% | 100,139 | 3.2% |
| Arkansas | $5.0B | 2.6% | 43,384 | 3.2% |
| New Mexico | $3.6B | 2.5% | 31,454 | 3.4% |
| Missouri | $10.7B | 2.4% | 90,581 | 2.9% |
| Georgia | $20.7B | 2.3% | 168,231 | 3.3% |
| Illinois | $26.4B | 2.3% | 179,162 | 2.8% |
| Oklahoma | $6.1B | 2.3% | 50,325 | 2.8% |
| Alabama | $7.3B | 2.2% | 71,755 | 3.2% |
| California | $87.9B | 2.2% | 589,354 | 3.1% |
| Iowa | $5.9B | 2.2% | 47,807 | 2.9% |
| Kansas | $5.1B | 2.2% | 39,828 | 2.6% |
| Kentucky | $6.4B | 2.2% | 56,360 | 2.7% |
| North Dakota | $1.8B | 2.2% | 15,511 | 3.3% |
| Ohio | $20.1B | 2.2% | 153,614 | 2.7% |
| Michigan | $15.1B | 2.1% | 124,965 | 2.7% |
| North Carolina | $17.8B | 2.1% | 155,462 | 3.0% |
| Texas | $59.4B | 2.1% | 402,103 | 2.8% |
| West Virginia | $2.3B | 2.1% | 21,936 | 3.0% |
| Nebraska | $3.7B | 2.0% | 30,234 | 2.8% |
| Pennsylvania | $20.4B | 2.0% | 176,752 | 2.8% |
| Maryland | $10.6B | 1.9% | 85,083 | 2.9% |
| Massachusetts | $14.6B | 1.9% | 107,987 | 2.8% |
| New Jersey | $16.2B | 1.9% | 128,138 | 2.9% |
| Virginia | $14.4B | 1.9% | 126,038 | 2.9% |
| Connecticut | $6.0B | 1.7% | 50,275 | 2.8% |
| Delaware | $1.8B | 1.6% | 16,706 | 3.3% |
| New York | $37.3B | 1.6% | 264,539 | 2.7% |
| District of Columbia | $1.8B | 1.0% | 13,657 | 1.7% |
1. How Big Is the U.S. Outdoor Recreation Economy In 2024?
BEA put the sector at $696.7 billion in value added for 2024. That makes the industry large enough to matter to payrolls and small businesses tied to travel, gear, lodging, guiding, and vehicles. BEA also reports 5.2 million jobs, 2.4 percent of current dollar gross domestic product, and gains in output, compensation, and employment. Campgrounds and gateway towns can use these figures when planning staffing, services, and seasonal capacity.
2. Which Outdoor Recreation Activities Add the Most Value?
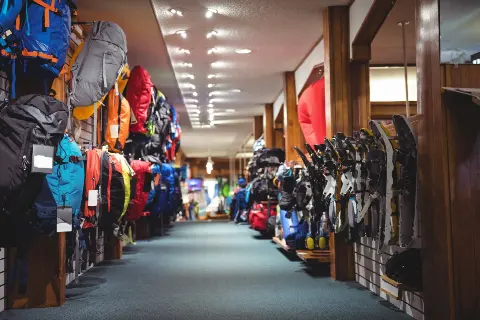
Boating and fishing lead the pack at $38.4 billion, according to BEA.
That scale makes sense because a day on the water can involve boats, engines, tackle, storage, fuel, guides, lodging, and restaurants. BEA also reports that this category was the largest conventional activity in 34 states, so its reach is broad across inland and coastal markets.
RVing shows a different business chain through vehicles, parts, campgrounds, insurance, repairs, and road-trip spending. Indiana’s lead in RVing points to manufacturing, while Colorado’s snow total points to resort towns and winter services. Time near water, RV routes, and snowy trips also help explain why camping is fun.
| Metric | Value | Source |
|---|---|---|
| U.S. Boating And Fishing Value Added, 2024 | $38.4 billion; largest conventional activity in 34 states | U.S. Bureau of Economic Analysis, Outdoor Recreation Economic Statistics, U.S. and States, 2024 (2024) |
| Top State Boating And Fishing Value Added, 2024 | Florida $4.4 billion; California $3.3 billion; Texas $3.0 billion | U.S. Bureau of Economic Analysis, Outdoor Recreation Economic Statistics, U.S. and States, 2024 (2024) |
| U.S. RVing Value Added, 2024 | $27.5 billion; largest conventional activity in nine states | U.S. Bureau of Economic Analysis, Outdoor Recreation Economic Statistics, U.S. and States, 2024 (2024) |
| Top State RVing Value Added, 2024 | Indiana $5.2 billion; Texas $2.7 billion; California $2.1 billion | U.S. Bureau of Economic Analysis, Outdoor Recreation Economic Statistics, U.S. and States, 2024 (2024) |
| U.S. Hunting, Shooting, And Trapping Value Added, 2024 | $16.5 billion; largest conventional activity in Arizona and Wyoming | U.S. Bureau of Economic Analysis, Outdoor Recreation Economic Statistics, U.S. and States, 2024 (2024) |
| Top State Hunting, Shooting, And Trapping Value Added, 2024 | Texas $2.0 billion; Florida $974.6 million; California $817.5 million | U.S. Bureau of Economic Analysis, Outdoor Recreation Economic Statistics, U.S. and States, 2024 (2024) |
| U.S. Snow Activities Value Added, 2024 | $7.6 billion; largest conventional activity in Colorado, New Hampshire, Utah, and Vermont | U.S. Bureau of Economic Analysis, Outdoor Recreation Economic Statistics, U.S. and States, 2024 (2024) |
| Top State Snow Activities Value Added, 2024 | Colorado $1.6 billion; California $730.5 million; Utah $598.2 million | U.S. Bureau of Economic Analysis, Outdoor Recreation Economic Statistics, U.S. and States, 2024 (2024) |
BEA reports these figures as current-dollar value added.
3. How Much Do Camping, Hiking, and Rving Add?
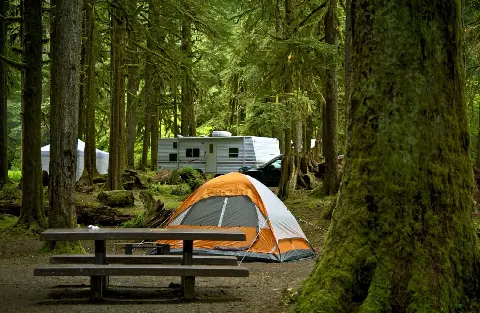
Tent camping, climbing, and hiking together added $7.8 billion in 2024, up 6.5% from 2023, while RVing added $27.5 billion. If you are joining the tent camping side of these numbers, our best camping tents for families guide is a practical starting point, while RV owners can read about boondocking on public land.
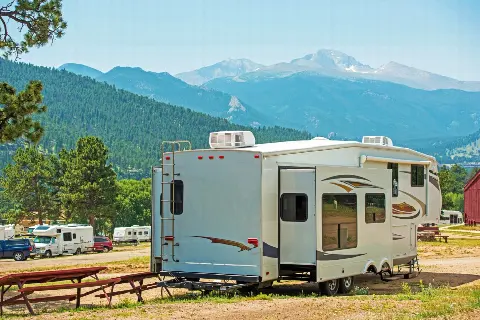
Tent camping sits in a separate BEA group with climbing and hiking. That group contributed $7.8 billion in 2024 and grew 6.5% from 2023 to 2024.
These categories point to more than nights in a campsite or miles on a trail. Gear, fuel, repairs, site fees, permits, food, and nearby services all connect ordinary trips to local business activity.
People who want to start camping can read these numbers as a sign of support around the activity. Stores, public agencies, private campgrounds, and repair services all have economic reasons to keep serving short outdoor trips.
| Metric | Value | Source |
|---|---|---|
| U.S. Climbing, Hiking, And Tent Camping Value Added, 2024 | $7.8 billion | U.S. Bureau of Economic Analysis, Outdoor Recreation Economic Statistics Release: The Recreation Economy’s Performance in 2024 (2024) |
| U.S. Climbing, Hiking, And Tent Camping Value Added Growth, 2023 To 2024 | 6.5% | U.S. Bureau of Economic Analysis, Outdoor Recreation Economic Statistics Release: The Recreation Economy’s Performance in 2024 (2023-2024) |
| U.S. Climbing, Hiking, And Tent Camping Value Added, 2023 | $7,465 million | U.S. Bureau of Economic Analysis, Outdoor Recreation Satellite Account, U.S. and States, 2023 (2023) |
4. Which States Lead the Outdoor Recreation Economy?
California is out front at $87.9 billion in 2024.
BEA data points to two different maps of the same activity. By total value added, the biggest numbers sit in major state economies such as California, Florida, Texas, New York, and Illinois. That fits a scale story. More residents, more businesses, and more travel spending can create a larger dollar total.
The share-of-GDP view tells a different story. BEA reports a 2024 range from 6.1% in Hawaii to 1.0% in the District of Columbia. A smaller or tourism oriented state can depend more heavily on outdoor recreation even if its total dollar figure is not the largest nationally.
Growth adds another angle. Massachusetts had 6.9% growth from 2023 to 2024, while Arizona had 6.8%. Those figures point to movement outside the largest total markets, which matters for outdoor brands, local planners, and anyone watching where recreation demand may be building.
5. How Did Outdoor Recreation Change from 2020 To 2024?
The sector took a -21.6% hit in 2020, then rebounded before slowing again by 2024.
BEA data point to an economy that snapped back as outdoor activity and spending resumed. The later pace looks steadier, with inflation-adjusted growth at 2.7% in 2024 after 5.3% in 2023. That matters because campgrounds, outfitters, and local trail towns may feel less surge pressure than they did during the rebound.
BEA real GDP figures are inflation-adjusted, while value added share figures use current-dollar GDP.
6. Which Industries Generate Outdoor Recreation Value Added?
The biggest slice comes from places people sleep, eat, and spend trip time: $174.4 billion.
BEA data places outdoor recreation inside ordinary trip spending, from trailheads, boat ramps, and campsites to hotels, restaurants, attractions, stores, and factories. That spread matters because a weekend outside can support workers who never set foot on the route or water.
Retail trade at $169.1 billion points to the force of advance purchases. Manufacturing at $91.3 billion ties trips to gear, vehicles, and related goods made before anyone packs the car. Trip budgets should include lodging, meals, supplies, and equipment, since those costs sit inside the same outdoor economy.
| Metric | Value | Source |
|---|---|---|
| U.S. Arts, Entertainment, Recreation, Accommodation, And Food Services Value Added, 2024 | $174.4 billion (25.0 percent); largest industry contributor | U.S. Bureau of Economic Analysis, Outdoor Recreation Economic Statistics, U.S. and States, 2024 (2024) |
| Top State Arts, Entertainment, Recreation, Accommodation, And Food Services Value Added, 2024 | California $24.1 billion; Florida $22.7 billion; New York $11.8 billion | U.S. Bureau of Economic Analysis, Outdoor Recreation Economic Statistics, U.S. and States, 2024 (2024) |
| U.S. Retail Trade Outdoor Recreation Value Added, 2024 | $169.1 billion (24.3 percent); second-largest industry group; largest in 24 states | U.S. Bureau of Economic Analysis, Outdoor Recreation Economic Statistics, U.S. and States, 2024 (2024) |
| Top State Retail Trade Outdoor Recreation Value Added, 2024 | California $19.3 billion; Texas $14.4 billion; Florida $13.4 billion | U.S. Bureau of Economic Analysis, Outdoor Recreation Economic Statistics, U.S. and States, 2024 (2024) |
| U.S. Manufacturing Outdoor Recreation Value Added, 2024 | $91.3 billion (13.1 percent); third-largest industry group; largest in Indiana and Louisiana | U.S. Bureau of Economic Analysis, Outdoor Recreation Economic Statistics, U.S. and States, 2024 (2024) |
| Top State Manufacturing Outdoor Recreation Value Added, 2024 | Texas $13.1 billion; California $11.6 billion; Indiana $9.1 billion | U.S. Bureau of Economic Analysis, Outdoor Recreation Economic Statistics, U.S. and States, 2024 (2024) |
7. What Did the Outdoor Industry Association Count In 2017?
The OIA framed the outdoor economy around buying trips, gear, services, and travel, led by $887 billion in annual consumer spending.
That frame treats outdoor recreation as a household spending sector and an employment base. It includes airfare, fuel, lodging, groceries, lift tickets, guides, lessons, gear, apparel, footwear, equipment, services, and vehicle purchases. Those categories explain why a weekend outside can support businesses far from the trailhead or campground entrance.
Camping was counted as a direct part of that economy, with $166,862,780,485 in annual outdoor recreation spending and 1,442,578 jobs. The salary and wage figure, $267,915,429,616, points to payroll tied to outdoor demand, not participation alone. This is also one reason why camping is fun can sit beside a serious local business story.
Trip planning should treat fuel, lodging, groceries, and guides as part of the same outdoor budget.
Most recent available data: Outdoor Industry Association, 2017.
Outdoor Recreation Economy by the Numbers
Methodology and Sources
The public data reviewed here do not measure unique participants, household spending, park visits, or future releases. BEA measures value added, output, jobs, and compensation. Outdoor Industry Association measures consumer spending and related jobs.
Watch the next BEA Outdoor Recreation Satellite Account release and the next Outdoor Foundation participation report.
Figures are reported as each source published them. Surveys with different methods are shown separately and were not combined.
- U.S. Bureau of Economic Analysis, Outdoor Recreation Economic Statistics, U.S. and States, 2024 (2024)
- U.S. Bureau of Economic Analysis, Outdoor Recreation Economic Statistics Release: The Recreation Economy’s Performance in 2024 (2024)
- U.S. Bureau of Economic Analysis, Outdoor Recreation Economic Statistics, U.S. and States, 2024 (2024)
- U.S. Bureau of Economic Analysis, Outdoor Recreation Satellite Account, U.S. and States, 2023 (2023)
- U.S. Bureau of Economic Analysis, Outdoor Recreation Satellite Account, U.S. and States (2023)
- U.S. Bureau of Economic Analysis, Outdoor Recreation Satellite Account: New Statistics for 2022 (2022)
- U.S. Bureau of Economic Analysis, Outdoor Recreation Satellite Account, U.S. and States, 2021 (2021)
- U.S. Bureau of Economic Analysis, Outdoor Recreation Satellite Account: New Statistics for 2021 and Updated Statistics for 2017 to 2020 (2021)
- U.S. Bureau of Economic Analysis, Outdoor Recreation Satellite Account, U.S. and States, 2020 (2020)
- Outdoor Industry Association, The Outdoor Recreation Economy (2017)
Last updated: November 2026
We update this page annually.